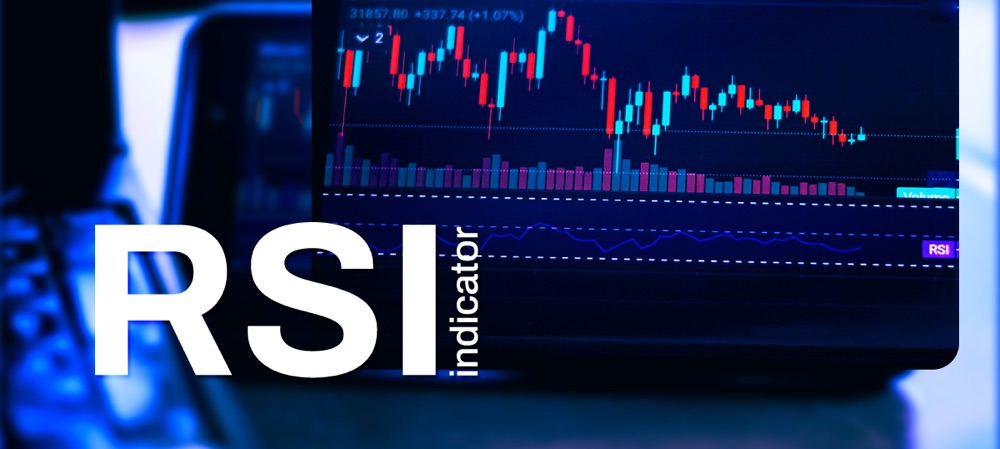
How to Use RSI Indicators to Find Entries and Exits in Crypto Trading
The Relative Strength Index (RSI) predicts price movements of an asset within a specified period of time. It’s an excellent tool when you want to have a firmer grasp on what your asset will do and make decisions accordingly.
In this case, the RSI can also predict price changes of cryptocurrencies. While it isn’t infallible by any means, if used correctly, a trader can gain a strong idea of how their coins will behave.
Despite having a lot of mechanics, the RSI is fairly easy to use. There are a few factors, which would help you use it more effectively if understood well. Some of us may already be familiar with things like RSI calculations and momentum. We’re also going to talk about divergence and how it affects buying and selling decisions.
RSI Calculations and Momentum
To calculate Relative Strength Index, we need a specified time period. The default range for this is 14 days. We take the average gains of a crypto’s price and divide that by its average loss.
Traders are also known to use 5-day periods and even 50-day periods, but records show 14 days to be more precise. In the stock market, trading isn’t always available seven days a week, so 14 days may not give you 14 trading periods. This, however, isn’t the case for cryptocurrency.
The average gain is the average of how much the price has increased from each of its low points within a time period. Conversely, the average loss is how much the price has gone down from each of its highs. We divide these two to get the RSI value. The RSI tool on Liquid will do all these calculations for you, but it’s always good to understand the derivation.
The RSI value is plugged into a graph with 1-100 on the y-axis. These numbers are used to indicate the likelihood of a change in the price movement.
As you’ve probably noticed when we edited the settings, there were two lines of 30 and 70. These are price lines and they indicate trade signals for an asset.
If crypto reaches past 70, it is considered Overbought. If it goes below 30 it is Oversold. An Overbought asset has been bought too much at a high price so there is a strong indication that it will go down. On the other hand, an Oversold coin has been sold too much at a low price so the RSI tells us it will likely go back up.
These are often trade signals that help investors make decisions on what to do with their assets. People will often sell their coins when it’s Overbought or buy a coin when it’s Oversold.
RSI Divergence
A divergence is when the RSI goes in the opposite direction from the price chart. When an asset is going up, it’s in a bullish trend. When it’s falling down, it’s in a bearish trend.
If the price chart shows an uptrend but in the RSI, the price starts to fall, we have a bearish divergence. This means the price will likely start to decline.
Conversely, if the RSI shows a downtrend when the price chart is displaying a rise, it’s a bullish divergence. That’s a strong indication of the end of a downtrend.
Keep in mind that divergences usually happen at the end of a trend (bullish or bearish.) That’s why we have price lines to indicate when a coin is Overbought or Oversold. Sometimes, the price doesn’t plummet or skyrocket right away but a while after passing price lines. We can avoid some of these gaps by adjusting the price line levels.
Setting Overbought and Oversold to 20 and 80 can increase the accuracy of RSI. You’ll start to notice fewer trade signals as the price lines are now extended. So when the price does reach an extreme, the trade signal would be more reliable.
Conclusion
The Relative Strength Index can be a powerful tool, especially for day traders. Of course, you can’t overly rely on it as the result is never guaranteed. A prediction is only an analysis of the past and has little to do with the future.
The RSI is only showing you what it thinks might happen to crypto or an asset based on how it performed in the past. There is always the possibility of the opposite happening. That shouldn’t come as a surprise to anyone in this field. While the RSI can take away some of the burdens of decision-making, you should always use it with consideration and do your own research before making a big move.
